On February 2, 2020, the Kansas City Chiefs accomplished the crowning achievement in the NFL, they became Super Bowl Champions! But Kansas City wasn’t the only big winner that night. In fact, maybe the biggest winners were Nevada sportsbooks. Nevada Gaming reports showed that sportsbooks pocketed $18.7 million of profit on $154 million of wagers on the Super Bowl! This was Nevada sportsbooks best return since the Seahawks took the crown back in 2014. This was also the second most bet Super Bowl that Nevada sportsbooks had seen. $154 million wagered!
With that kind of money being put up against the sportsbooks, is it possible to beat the bookies and get a piece? I wanted to see if there was any low hanging fruit that one could find value in when choosing which side of a spread or total score bet in the NFL. In order to keep this analysis as simple as possible I isolated it to a few key indicators to look at:
- Win % for betting only favorites against the spread
- Win % for betting only underdogs against the spread
- Win % for betting only road favorites against the spread
- Win % for betting only road underdogs against the spread
- Win % for betting only home favorites against the spread
- Win % for betting only home underdogs against the spread
- Win % for betting only over on totals
- Win % for betting only under on totals
The question I wanted to answer was: would betting only on any othe above groups thru the course of a season would result in a positive outcome? Was there any inherent value in betting favorites that are on the road vs betting home underdogs? This was the most simplistic approach to see if there was something that bookmakers maybe overvalued or overlooked. My initial thought was that there would be some type of value that could be found, even if it was small. Another assumption that was made was that you were getting the same odds regardless of the side you took. I know this isn’t always the case but, for simplicities sake and to make the least amount of assumptions that is what I did in this analysis.
Can we beat the sports books just by finding some undervalued sides of a spread or total bet? In order to do that, what exactly would we need to do to beat the bookies? I assumed the odds that you would get for either side of a spread or a total would be -110 – a very common odds for spread and total betting. This means for every $100 you bet you would win an additional $90.90. If you got -110 for each bet you placed, in order to break even you would need to win ~52.3% of your bets. Really? Picking just over half of your bets correct would result in coming out on top and beating the bookie? That doesn’t seem so difficult when you look at it like that does it? Well let’s look and find out just how good these sports books are at setting a line.
The dataset that I used was used from Australia Sports Betting. This included all NFL games from 2006-2020. The first thing that I wanted to look at was betting against the spread. Using the groups mentioned above and looking at how each group performed against the spread would give me some insight into if there was some value to be had by betting certain groups. With the 52.3% as our benchmark lets see how well these groups performed against the spread year over year.
Bet The Underdogs
After digging into the data there are a couple of findings that stood out. Road underdogs outperformed the 52.3% benchmark in 9 out of the 14 years. This was the top performing group over the fourteen-season span. Not only were they the top performing group, they outperformed the benchmark more than 2x the amount than the next closest group – home underdogs. The worst performance would have just been to just bet favorites over the course the span, as that group failed to beat the breakeven benchmark in every season since 2006.
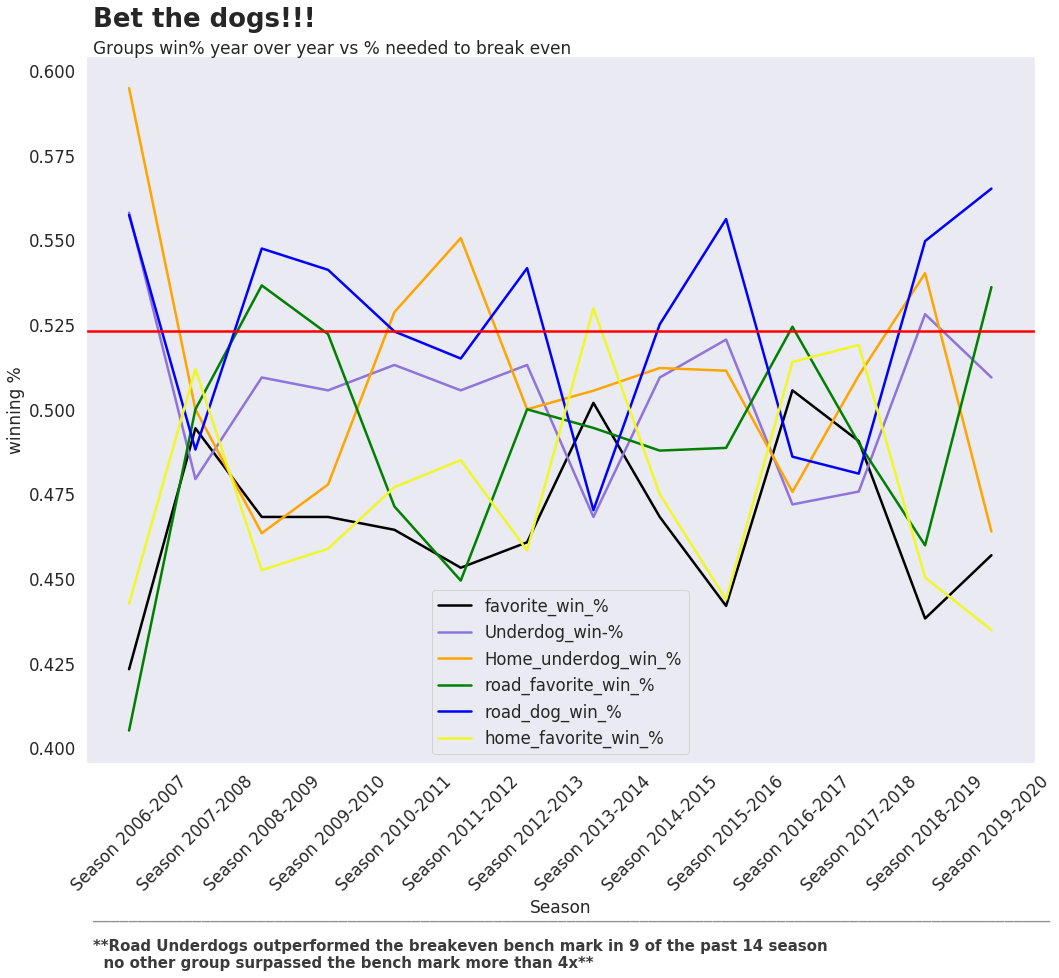
Would betting the underdogs – home or away – be a good strategy? In the short term that might seem like a good strategy. Afterall road dogs did outperform the benchmark more than half the time, right? Well, running with the dogs appears to level off in the long run. Over the course of fourteen seasons only betting road underdogs would have resulted in beating the breakeven by a mere 15 basis points. No other group over that span came within a full percentage of the breakeven point. Sportsbooks appear to be proficient at setting a spread for a given game. Unfortunately for us it wont be as easy as only betting a certain group if you want to come out on top.
| Group | road underdog % | break even % | home underdog % | underdog % | road favorite % | home favorite % | favorite % | push % |
|---|---|---|---|---|---|---|---|---|
| Mean | 52.48% | 52.3% | 50.96% | 50.48% | 49.04% | 47.52% | 46.68% | 2.84% |
Take the over!!
What about score totals? With score totals sports books set a total that would be the combined total of the two teams. You then can take either side of that total, betting that the combined score would be over, or under the total set by the bookmakers. Is there some value to be found in betting certain overs? In the words of Dan ‘Big Cat’ Katz, “Life’s too short to bet the under”! Let’s find out if there is value in following this wise man’s advice!
In the table below we see that by simply betting the over during a season we would have surpassed the 52.3% breakeven mark in only three of the fourteen seasons. Betting the under we would have finished above breakeven in three of the past fourteen seasons. So it’s definitely more fun to be the over, especially when it would have beat the benchmark the same amount!
| Hit % sorted by hightest over% | Hit % sorted by hightest under% |
|---|---|
| | Season | Over Hits% | Under Hits% | | :------ |:--- | :--- | | Season 2010-2011 | **55.06%** | 43.82% | | Season 2016-2017 | **53.18%** | 46.07% | | Season 2007-2008 | **52.81%** | 45.32% | | Season 2013-2014 | 50.19% | 47.57% | | Season 2019-2020 | 49.44% | 49.81% | | Season 2011-2012 | 49.44% | 49.44% | | Season 2012-2013 | 49.06% | 49.44% | | Season 2006-2007 | 48.31% | 47.94% | | Season 2008-2009 | 47.94% | 49.06% | | Season 2009-2010 | 47.91% | 51.69% | | Season 2017-2018 | 46.82% | 53.18% | | Season 2018-2019 | 46.44% | 52.43% | | Season 2015-2016 | 46.44% | 51.69% | | Season 2014-2013 | 46.44% | 52.43% | | | Season | Over Hits% | Under Hits% | | :------ |:--- | :--- | | Season 2017-2018 | 46.82% | **53.18%** | | Season 2018-2019 | 46.44% | **52.43%** | | Season 2014-2015 | 46.44% | **52.43%** | | Season 2015-2016 | 46.44% | 51.69% | | Season 2009-2010 | 47.19% | 51.69% | | Season 2019-2020 | 49.44% | 49.81% | | Season 2012-2013 | 49.06% | 49.44% | | Season 2011-2012 | 49.44% | 49.44% | | Season 2008-2009 | 47.94% | 49.06% | | Season 2006-2007 | 48.31% | 47.94% | | Season 2013-2014 | 50.19% | 47.57% | | Season 2016-2017 | 53.18% | 46.07% | | Season 2007-2008 | 52.81% | 45.32% | | Season 2010-2011 | 55.06% | 43.82% | |
Alright, so bookies are very good at setting these spreads and totals it seems. One last thing I wanted to look at was if there were any specific point totals that bookies frequently set that we could find some inherent value. First, I looked at the frequency at which bookies set a total and compared that with the frequency at which the total of the actual outcome occurred.
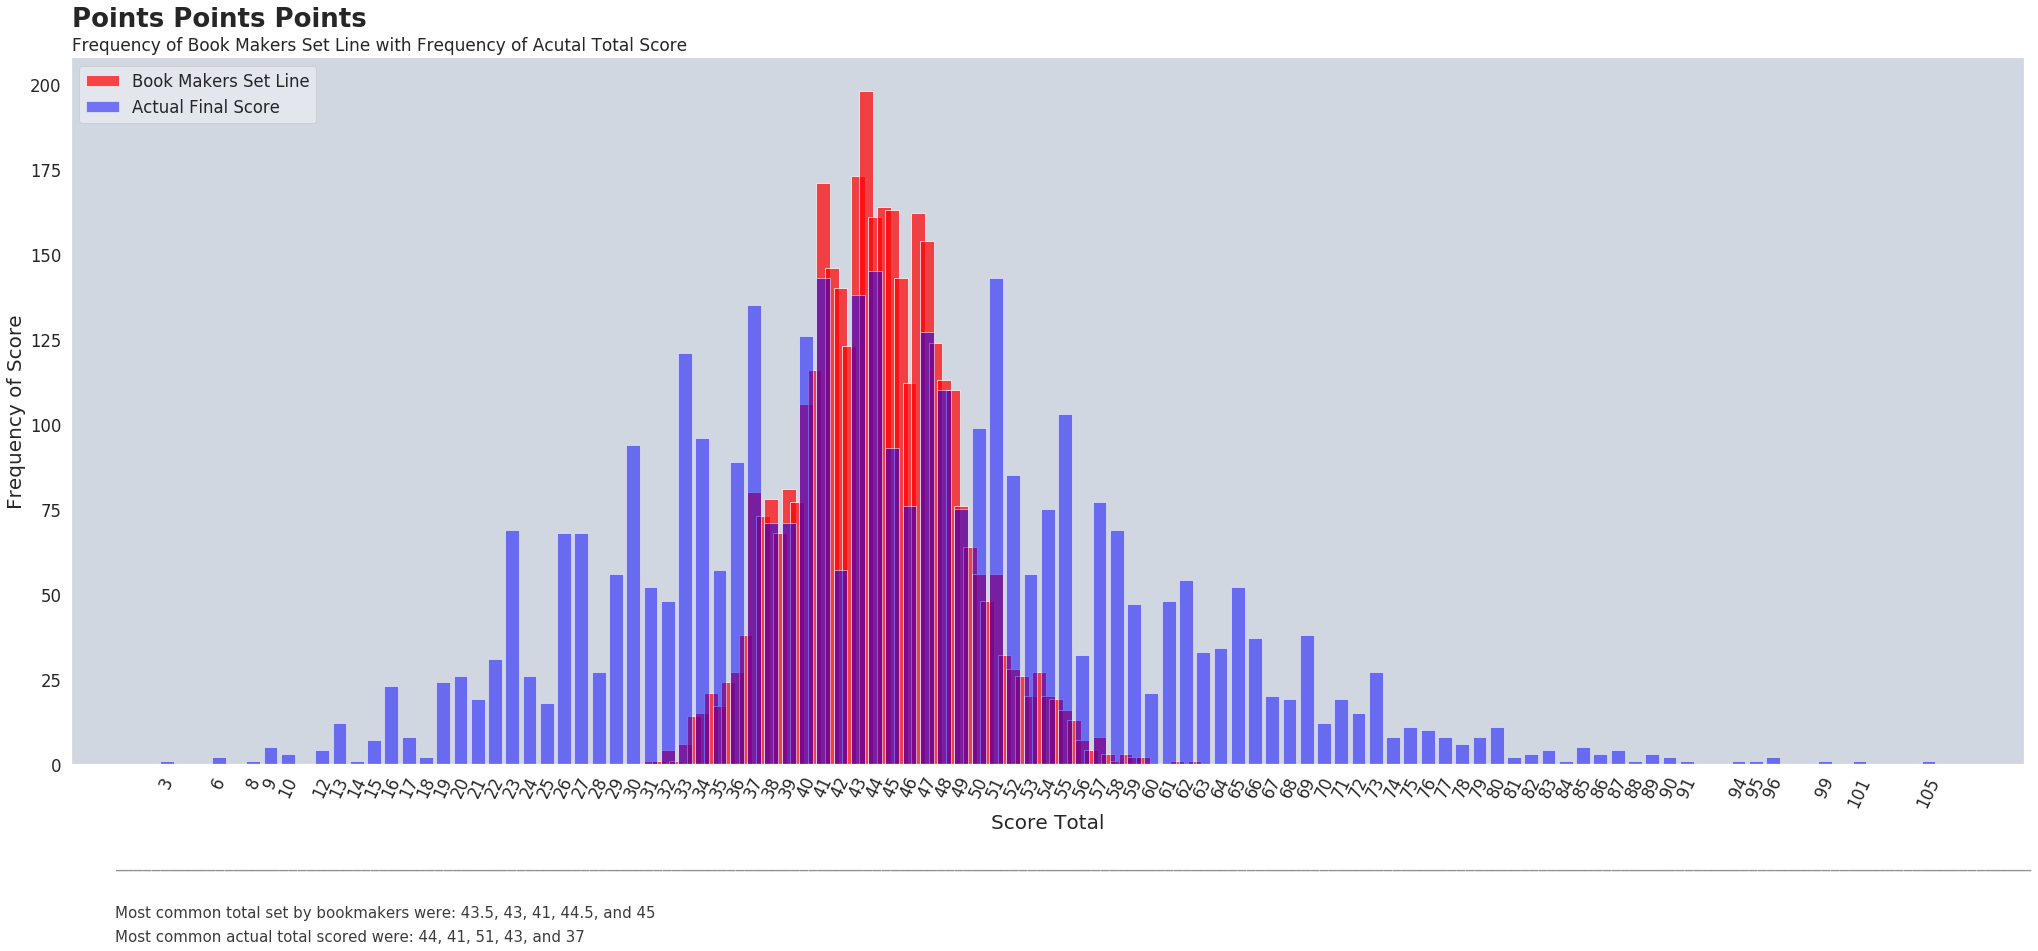
Sportsbooks most frequent totals that they set were: 43.5, 43, 41, and 45 respectively. While the most frequent actual total outcome of games played were: 44, 41, 51, and 37 respectively. Just by using the eyeball test those are very close! The most common occurrence of 43.5 for the bookies compared to 44 for actual outcomes! Very tight lines! But in looking at the graph you can see that there are some actual final scores that are occurring much more frequently when compared to the amount of times bookmakers are setting a line with that same total. At first glance this would indicate that there are specific point totals that bookies are setting that maybe we can find some hidden value!
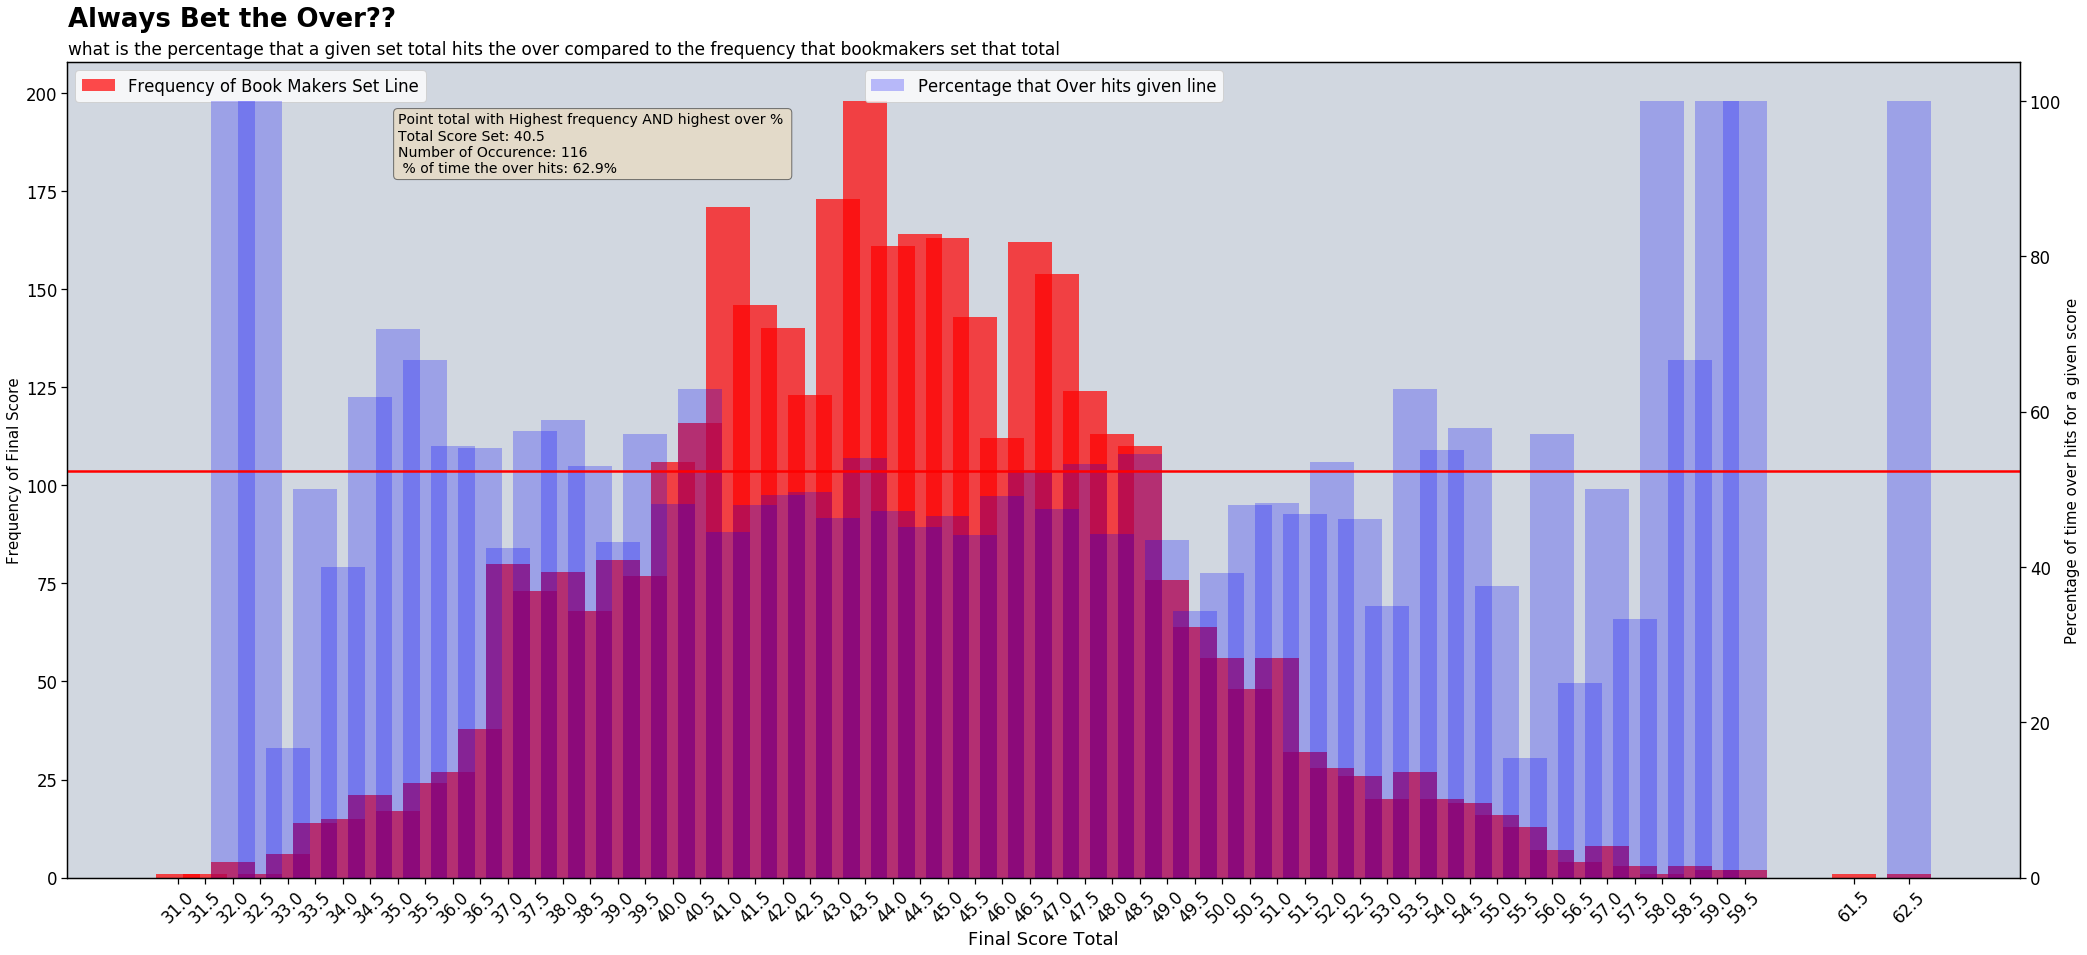
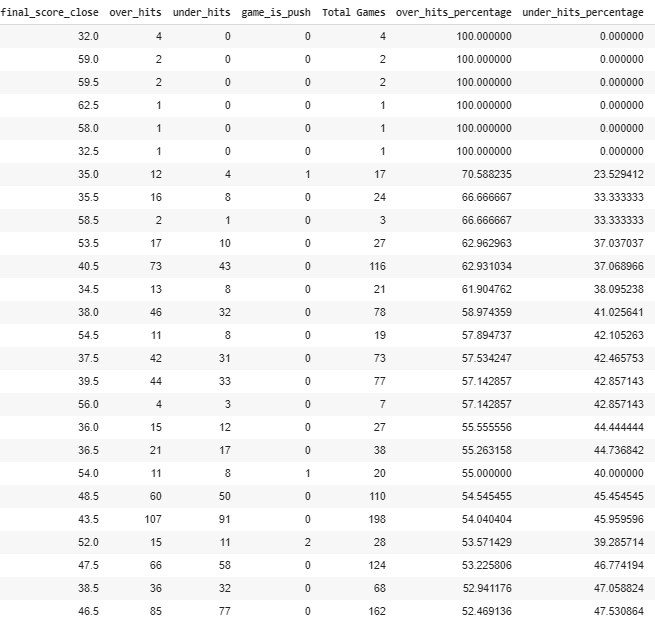
Magic Numbers
Always bet the over when you see a bookmaker set a line at 40.5! The most common line that bookmakers set that had the highest over percentage was 40.5 at a whopping 62.9%! That is a big margin considering you only need to hit 52.3% to break even! This line was set 116 over our 14 span season. Not the most frequent set line but by no means was it a rare occurrence to see that line. In fact, it was the 14th most common line out of the 91 unique point totals that sports books set. There are a few other games that hit that were of note as well. There were 26 unique totals set that all had an over hit % that was greater than the breakeven benchmark. Most are not common occurrences… but if you ever do happen to catch a bookie set those lines, remember to always, always bet the over!!